Sound Model Comparison
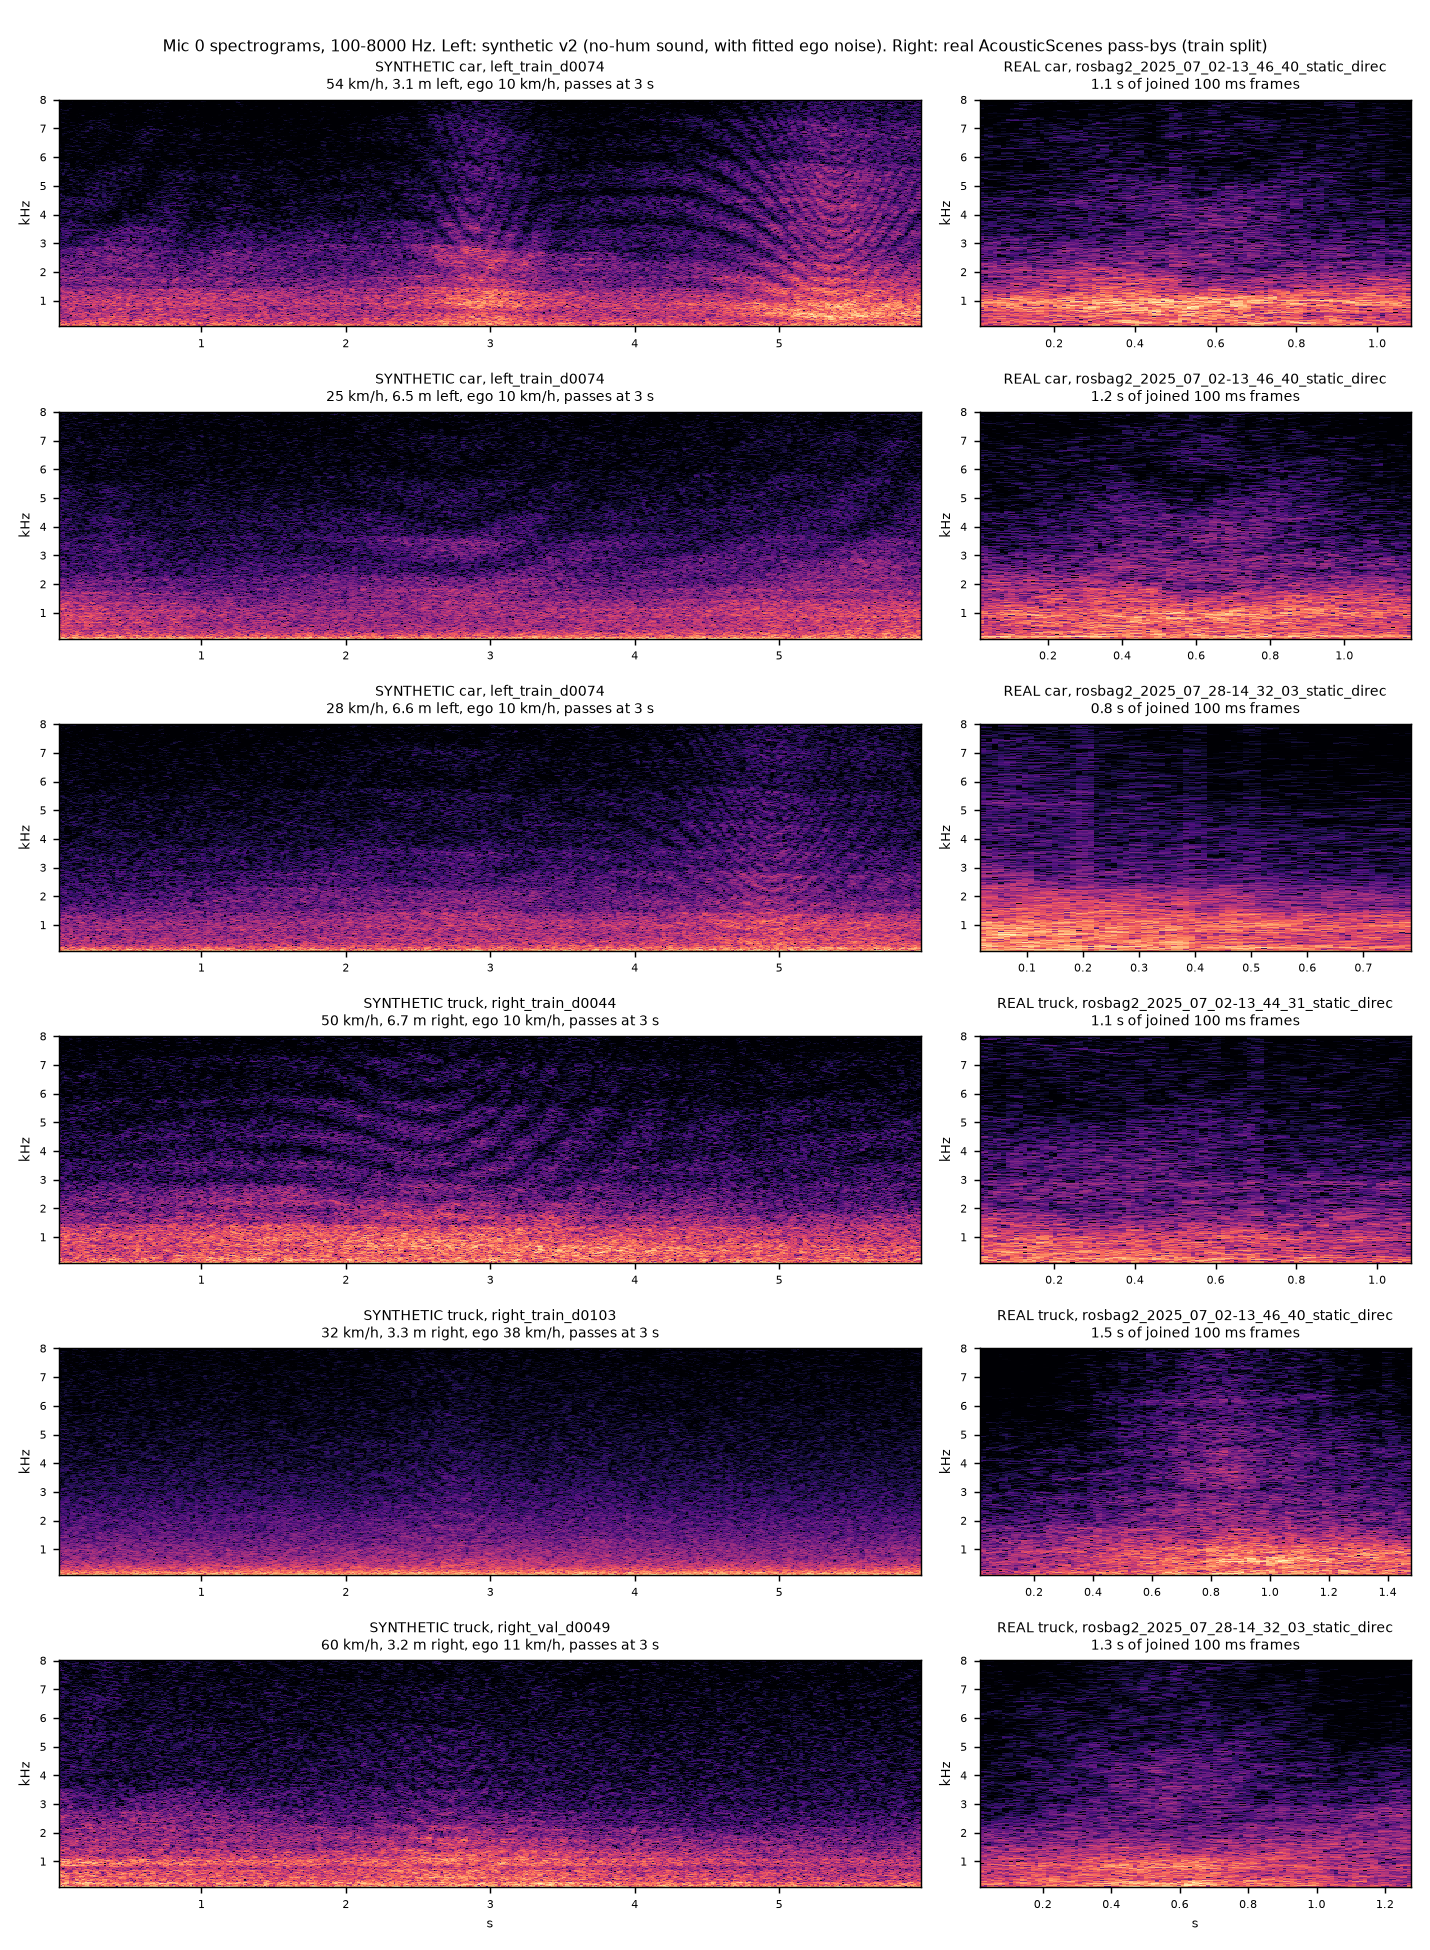
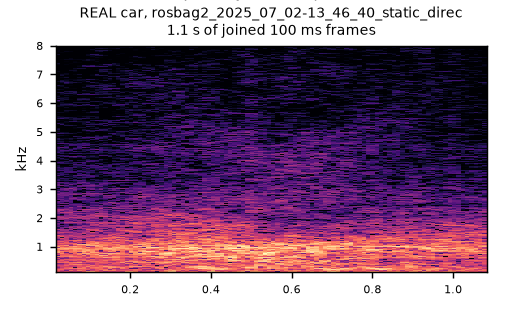
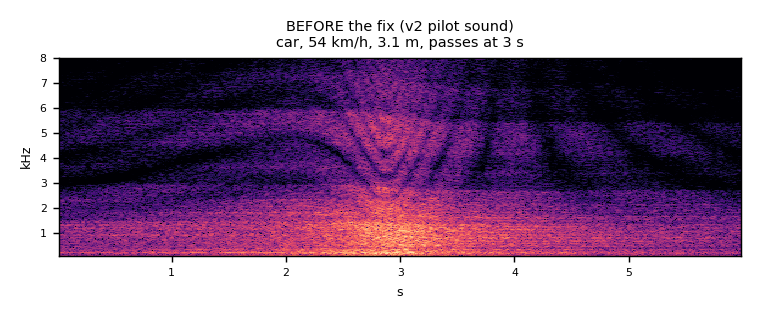
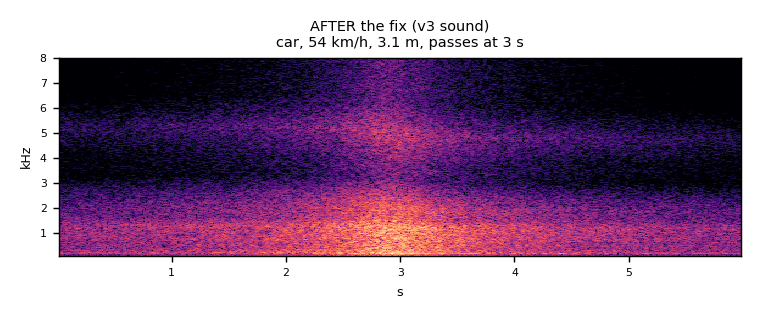
Spectrograms of one car and one truck pass-by: a real recording, the old simulation and the current simulation.
Real recordingOld simulationCurrent simulation
Car, 54 km/h, 3.1 m to the side
Truck, 50 km/h, 6.7 m to the side
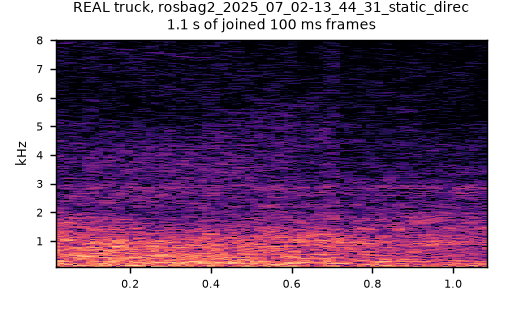
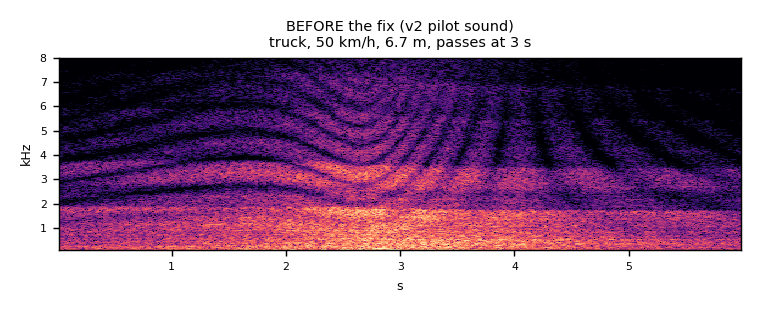
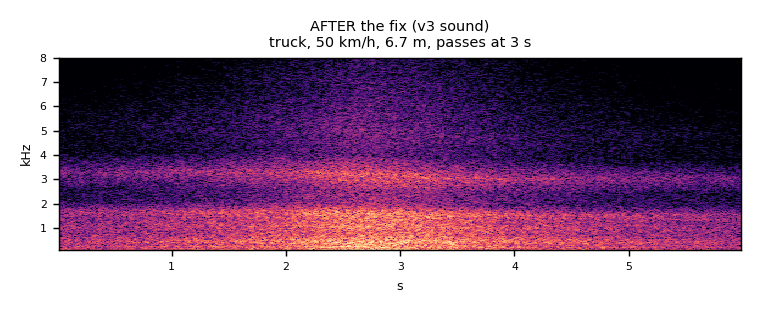
Microphone 0, 100 to 8000 Hz, same settings in every panel. Simulated clips are 6 s long; the vehicle passes at 3 s. The real recording is a different vehicle of the same type. It is only 1.1 s long (the dataset keeps 0.1 s of audio per frame), so it has no audio player.
Changes
1
Old simulation. The ground reflection caused curved stripes between 2.5 and 7 kHz, and the filter bank caused level steps in the spectrum.
2
Current simulation. No ground reflection, a smooth spectrum, and an independent signal for each sound source of a vehicle.
3
Real recordings. Neither the stripes nor the steps appear in the AcousticScenes recordings.
More examples of the old simulation